Poultry Genetics for the Nonprofessional
Brief introduction
The purpose of this document is to provide a poultry genetics reference to interested poultry enthusiasts who may not have any formal training in genetics. My personal goal is to provide the enthusiast with the document that I wish I had had when I started poultry keeping.
Literature sources are primarily Poultry Breeding and Genetics, Elsevier 1990, R.D. Crawford, Editor, books by F.P. Jeffrey, W.F. Hollander, F.B. Hutt and poultry science journals like Poultry Science which are available in most university libraries. Care is taken to keep the information in these pages current and to correct any errors.
Part III is a list of chicken genes with comments regarding gene functions and related information which we hope will be an easy-access reference for poultry enthusiasts.
I. Basic Genetics
I am intentionally avoiding jargon. However, there are a few basic terms that are necessary.
A gene is a piece of DNA that carries information about a specific trait.
A chromosome is a string of genes connected together (although most of the chromosome is DNA that has no known function or no genetic activity).
An allele is a gene that is a member of a set of genes that all belong to the same locus, or location, on a chromosome. These genes are often thought of as being related to each other through mutations (one allele could be a mutation of another allele) or they could be mutations of an ancestor gene.
Chickens, like people, usually have two of every chromosome. The chromosomes in a chromosome pair are not identical, since one comes from each parent. A gene is said to be dominant when only one gene (rather than two) is sufficient for the expression of that trait to which the gene corresponds. Some genes are referred to as incompletely dominant. The expression of these genes is inhibited by (usually unknown) modifying genes. When the inhibiting, modifying genes are not present, the incompletely dominant gene expresses. This interaction with modifying genes is responsible for the seemingly random nature of the expression of incompletely dominant genes.
The sex chromosomes are unique in that there are two types, a long sex chromosome, the Z chromosome, and a short sex chromosome, the W chromosome. The female has one long and one short sex chromosome, she has ZW sex chromosomes. The male has two long sex chromosomes, he has ZZ sex chromosomes. For this reason, the female has only one copy of some genes that are on the long, Z, sex chromosome.
The genes that are not on the sex chromosomes are called autosomal or autosomes. Both male and female chickens have two of these genes. Chickens have 39 pairs of chromosomes (78 individual chromosomes). Most of them are tiny and referred to as dot or micro chromosomes.
An important point is that, when we talk about adding or removing a gene, say frizzle, F, we dont intend that the chromosome is lengthened or shortened by the addition or deletion of that gene. Rather the frizzle gene, F, replaces the gene of the wild-type jungle fowl, f+, when it is added, or, it is itself replaced by the wild-type jungle fowl gene, f+, when frizzle is removed. I used the frizzle gene as an example here, but the statement applies to all genes.
The original members of a mating are referred to as the parental (P) generation. The first generation of progeny from the parental cross is referred to as the first filial generation, F1. The progeny of a cross in which one or both of the parents are from the F1 generation is an F2 generation (F1 x F1 = F2) and so on.
For the interested reader who might like to know the meaning of these terms, I have included this brief description. A bird that has one gene, rather than two, for a specific trait is said to be heterozygous for that trait. A bird that has two genes for a given trait is homozygous for that trait. The genotype is the actual set of genes. The phenotype is the appearance or visual characteristics what you can see. For example, a bird that is heterozygous (has one gene instead of two) for a given dominant trait may look the same as, or similar to, one that is homozygous (has two genes) for that trait. They both have the same appearance or phenotype. Because the female fowl have differing sex chromosomes, the long one, Z, and the short one, W, the Z chromosome has gene locations that the W chromosome does not (see above). Sometimes when referring to these genes that have no counterpart on the W chromosome, the female is said to be hemizygous. Since the female can have only one copy of these genes, there is an apparent overlap in the meanings of 'heterozygous' and 'hemizygous'.
How to predict the outcomes of breeding events for non-sex-linked and sex-linked traits
Non sex-linked traits:
Both parents have two genes for a given trait. Lets consider the gene for frizzle plumage, F, and agree that we will represent the lack of the frizzle gene with f+. The superscript + indicates that the gene is present in the wild-type fowl which, with respect to chickens, is the red jungle fowl. Here, I apply the jargon immediately above, but will minimize the use of it from now on. A bird is said to be heterozygous for frizzle if her genotype is (F, f+) and homozygous if her genotype is (F, F). Since frizzle is dominant, both genotypes will have the same (or similar) appearance or phenotypes. (In this particular case, frizzle shows a 'dose effect' and the frizzle homozygote has brittle feathers that usually break off so the homozygotes can be almost bare. There is a common recessive modifying factor, mf, that reduces the influence of the frizzle gene.)
To determine the genetics of the offspring, one takes the four possible combinations of the genes of one parent with the genes of the other parent. For example, lets consider a cross between a bird that has two frizzle genes, homozygous for frizzle, (F, F) and one that is without frizzle, (f+, f+). It helps with the bookkeeping for our purposes here if we (artificially) number the genes: (F1, F2) and (f+1, f+2) so that F1 is the first frizzle gene of the first parent, F2 is the second frizzle gene of the first parent and so on. The four possible pairs that can be made by combining these genes are: (F1, f+1), (F1, f+2), (F2, f+1) and (F2, f+2). Since frizzle is a dominant trait, these four gene combinations will result in chickens with frizzle plumage (they will all have the same or similar phenotypes). In practice one would not number the genes as I have done in this paragraph. I numbered them to distinguish the four combinations, since they are all genetically the same. One would normally write: (F, F) crossed with (f+, f+) gives (F, f+) times 4.
So, in order to get the four combinations of the genes of the two
parents, just take the first gene of the first pair with each gene of the second
pair, then do the same thing with the second gene of the first pair.
The figure below illustrates how to get the combinations of genes of one
parent, (A, B), and the genes of another parent, (C, D). The
four possible combinations are (A, C), (A, D), (B, C) and (B,
D). 
Sex-linked traits:
Genes responsible for sex-linked traits are on the long sex chromosome, Z, but not the short sex chromosome, W. For that reason, I prefer to use a blank or underscore to represent the missing gene when representing the genes (genotype) of the female. Some people write a 'W' to indicate that the presence of the W sex chromosome which lacks the locus for the gene in question. Rather than writing (B, -) to represent a barred female, some authors write (B, W) or B/W with the slash separating the gene symbols for the different chromosomes. I include a clickable link to the chicken gene tables so the reader can look up the genes that are used in these examples.
A Punnett diagram (or Punnett square) for determining the mating outcomes for sex-linked traits is below:
In this example the fact that the female can have only one gene is represented with a dash or underscore in one column of quadrants. The dash or underscore actually represents the W chromosome which is what makes her female. The other gene symbols represent genes that are all allelic to each other (that means that they all belong to the same location on the chromosome). The chicks that 'inherit the dash' really inherit the W sex chromosome and are therefore female. In the example in the Punnett square above, the (A,_) and (B,_) chicks are the females.
As an example of sex-linked barring (I use it a different way below), the A and B gene could both represent the wild-type gene, b+, which is lack of barring. The X gene could represent the barring gene, B. So this is a mating between a barred female and a nonbarred male. The Punnett square predicts that all the male chicks will be barred [(B, b+) genotype] and the females will all be nonbarred [(b+, _) genotype]. Punnett square below is this mating example (The Punnett_Monkey is an application that will do the Punnett square for you.):

Saying the same thing a little bit differently, Cuckoo barring or sex-linked barring, B, is one of these genes that is located on the Z chromosome (recalling that the male has two Z sex chromosomes and the female has one Z and one W sex chromosome and there is no barring gene on the W chromosome so females can have only one). A male with two copies of the barring gene might be represented as (B, B). This is his genotype with respect to barring. A male with one copy is represented as (B, b+) where lower-case b+ indicates a lack of the barring gene and the b+gene is the gene that the wild red jungle fowl has instead of the barring gene, B. A male with no barring is represented as (b+, b+). Since the female has one long chromosome and one short chromosome and the barring gene is on the long chromosome and not the short one, a female can have only one copy of the barring gene. A female with barring is represented as (B, _). A female without barring is represented as (b+, _). The underscore indicates her short chromosome lacks the locus (location) of that gene.
I distinguish between the terms sex-linked and sex-indicating. A gene is sex-linked when that gene is on the long sex chromosome and not the short sex chromosome. A sex-indicating trait is one that arises from a sex-linked gene if the cross is carried out properly. The following example indicates this.
When a barred female, (B, _) is crossed with a non-barred male, (b+, b+), the four possible outcomes (see the figure above) are: (B, b+), (b+, _), (B, b+) and (b+, _). Here I have written all four combinations even though some are the same. The order of writing the genes of the pair is usually to write the dominant gene first and the blank last. Of the four possible outcomes, the males are barred and the females are non-barred. So, when the cross is carried out this way, barred female x non-barred male, the barring is a sex-indicating trait, and indicates male offspring.
When a barred male, (B, B) is crossed with a non-barred female, (b+, _), the four possible combinations of the genes are: (B, b+), (B, _), (B, b+) and (B, _). Therefore all the chicks will be barred. The barring is still a sex-linked gene, but the cross was carried out in a way that leads to both males and females being barred. In this situation the barring is not indicative of the sex of the offspring.
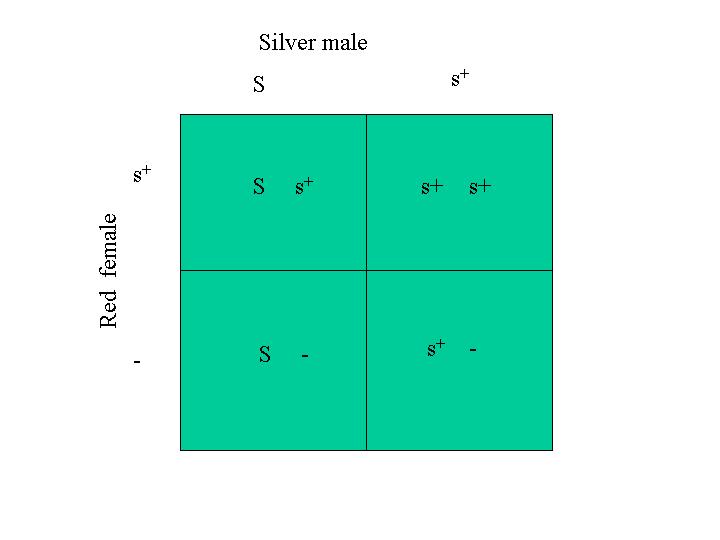
The Sil-Go-Links (for silver-gold-sex-link) are similar except that the dominant sex-linked gene is the silver gene, S, which has the function of inhibiting the red pigment, pheomelanin. The lack of the silver gene is represented with lower-case s+. Here again, s+ is the gene that the wild-type fowl or red jungle fowl has instead of the silver gene. Crossing a red male lacking silver, such as a Rhode Island Red (s+, s+), with a silver female, such as a Delaware (S, _), gives (S, s+), (S, s+), (s+, _) and (s+, _). So, the males are silver (which means mostly white) and the females are red and can be sexed after hatching. Carrying out the cross the other way, a silver male (S, S) and a red female (s+, _) gives as possible combinations: (S, s+), (S, s+), (S, _) and (S, _) so that the red pigment in both males and females is inhibited and they will be mostly white.
Black sex-links can be made by crossing Barred Rock females with a red male, such as Rhode Island Red or New Hampshire Red. The Barred Rock females have one barring gene, (B, _) and should have two nigrum genes (E, E). The nigrum gene extends black by changing red to black. The red male will be (b+, b+) for barring and lacking in nigrum, (e+, e+). Here the lack of nigrum is represented with the symbol, e+, which indicates that, instead of the nigrum gene, E, the bird has the wild-type gene that the red jungle fowl has.
With respect to the barring, the four combinations of the genes are: (B, b+), (B, b+), (b+, _) and (b+, _). So the males are barred and the females are not. With respect to the nigrum gene, all four combinations are the same, (E, e+). So, for this set of genes, all the chicks will be black and the males will be barred. The Punnett_Monkey is an application that will do the Punnett square for you.
How to predict the outcome of a breeding event when two pairs of genes are involved:
This is relevant in poultry genetics because there are traits that depend on two or more gene pairs. The Advanced Punnett_Monkey is an application that allows the user to select as many as four independent traits and, with a few mouse clicks, determine the frequency, in percent, that a given genotype will appear in the progeny. The comb type is an example. Shank and foot color are traits that depend on three pairs of genes. What we do in a case such as comb type that is determined by two pairs of genes, is to determine the combinations of the genes of each parent for both sets of genes. We then realize that the combinations of the first genes can occur with any combination of the second genes. So, we have to consider all the possible combinations of the genes of the first set with the genes of the second set.
An example illustrates this. Suppose a trait is determined by two sets of gene pairs on different chromosomes. A male with a genes (A, B) and (W, X) for this trait is crossed with a female having genes (a, b) and (w, x) for the same trait. The possible combinations from the first gene pair are: (A, a), (A, b), (B, a) and (B, b). The possible combinations of the second set of genes are: (W, w), (W, x), (X, w) and (X, x). Were not finished because each combination of the first set of genes can occur with any combination of the second set of genes. To determine these double combinations it is helpful to make a drawing:
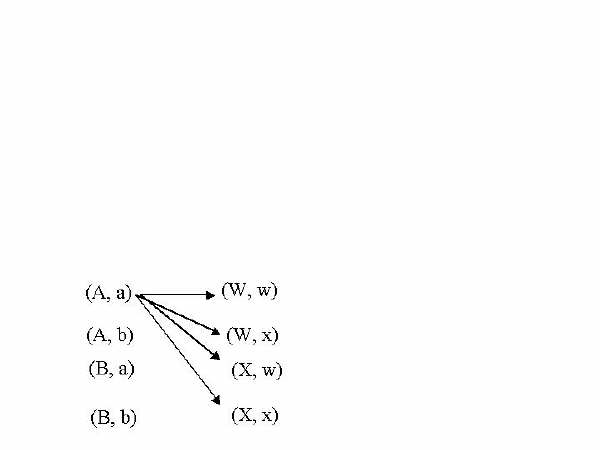
The arrows in the figure above indicate the combinations of the (A, a) gene pair with the four combinations of the second genes: (A, a) with (W, w); (A, a) with (W, x); (A, a) with (X, w); and (A, a) with (X, x). Next we do the same thing except using the (A, b) gene pair instead of the (A, a) one. Then again with the (B, a) gene pair and lastly with the (B, b) gene pair. This gives 16 double combinations.
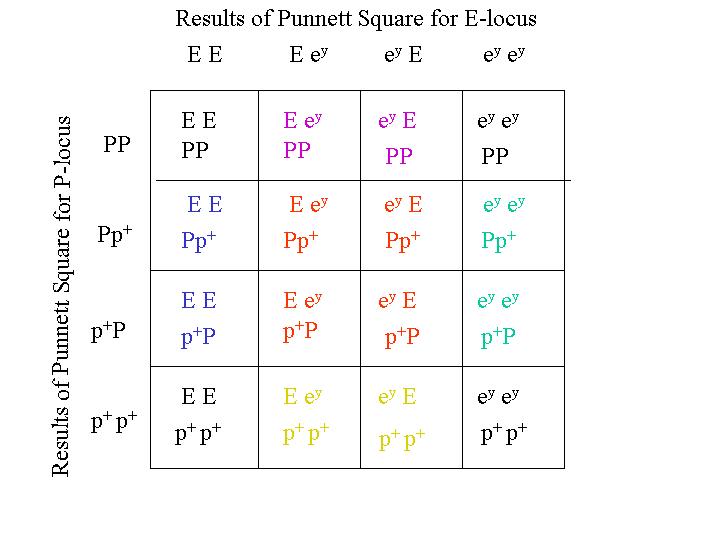
Punnett diagram for the inheritance of two traits
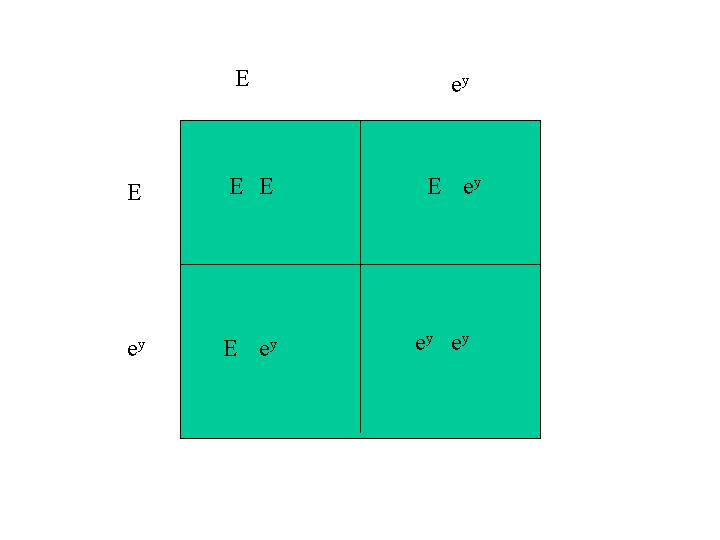
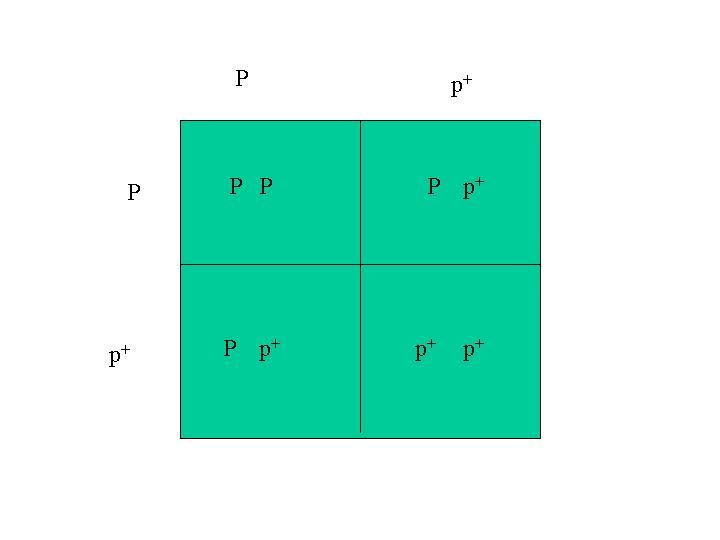
The inheritance of two sets of gene pairs can be determined by the use of a Punnett diagram. In these examples, I start with single traits and work with Punnett diagrams. The strategy is to use Punnett diagrams to determine the combinations for the single traits separately, then use those Punnett square combinations to make the larger Punnett square for the inheritance of both traits together. The Araucana black large fowl is homozygous for both dominant black, E, and pea comb, P. The Rhode Island Red is homozygous for recessive wheaten, ey and single comb, p+ (which is really the lack of the pea comb gene). A mating between an Araucana black large fowl and a Rhode Island Red gives sons and daughters that belong to the F1 generation and are all heterozygous for dominant black E, recessive wheaten, ey, P (pea comb) and p+ (lack of pea comb). A mating between two of these F1 chickens is what I consider here. So, this is what you would get in the F2 generation.
The F1 sons and daughters are heterozygous for both traits. The F1 fowls are (E, ey) and (P, p+). Since we know this already, we don't need to use a Punnett square to determine the distribution of traits in the F1 generation. We do, however, need to use a Punnett square to determine how the genes combine with each other in the F2 generation (F1 x F1). Then we use a Punnett square again to determine how the two separate traits appear with each other. So the Punnett square for first trait has E and ey on both edges. The other one has P and p+ on both edges. These two Punnett squares determine how the genes for these traits are inherited separately in the F2 generation from F1 matings. The Punnett square for the inheritance of the individual traits are:
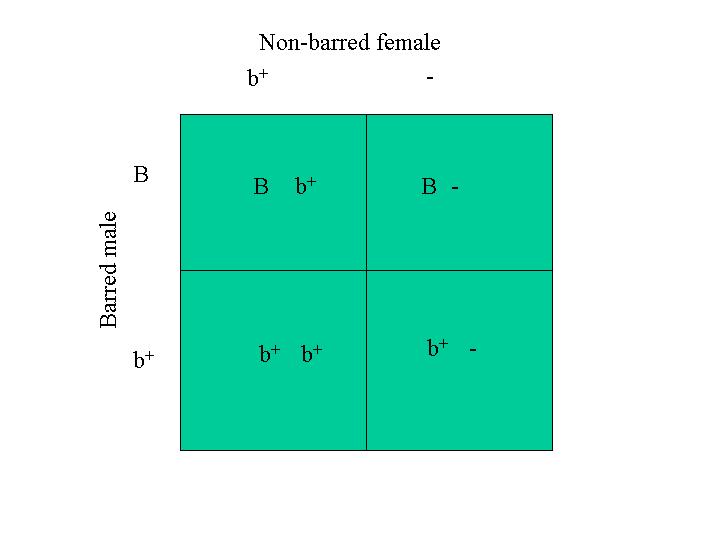
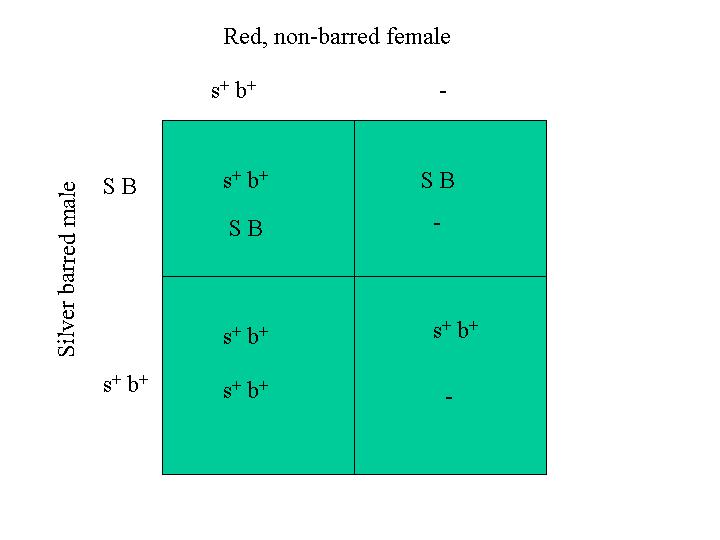
Because sex-linked traits are popular with fanciers, this next example considers the inheritance of two sex-linked traits. Consider the cross between a male that is heterozygous for silver and barring and a female that is red, non-barred. His genotype is (S, s+) with respect to silver and (B, b+) for barring. Her genotype is (s+, - ) with respect to silver and (b+ - ) with respect to barring. First, I make a Punnett square for the inheritance of the silver trait and another for the barring trait. I then make another Punnett square with the results of these Punnett squares.
For the silver trait, the Punnett square is:
The Punnett square for the barring trait is:
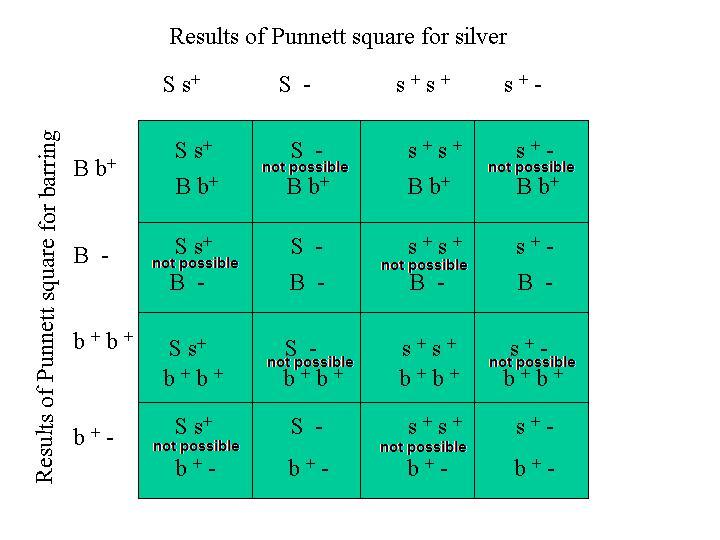
Since there are 16 interior squares in this Punnett Diagram, there are 16 possible combinations of the four genes. Because these genes are linked, the appearance of each combination is not equally probable. See the discussion of linkage below. If the two traits, silver/gold and barring/non-barring had not been on the same chromosome, then we could consider each combination in the Punnett diagram above to be equally probable with the probability being the number of times a specific combination appears in the Punnett diagram divided by the number of squares inside the Punnett diagram.
Adding a third gene pair, as one would have to do to consider shank/foot color (assuming those genes are on different chromosome), is essentially the same procedure just expanded by a third gene pair. This gives 64 total combinations.
Genes on the same chromosome are linked and usually inherited together. Two genes that are always inherited together would be linked 100% of the time. However, linkage is never 100% because crossover events occur when the body manufactures sperm and egg cells. The figure below illustrates a crossover event.
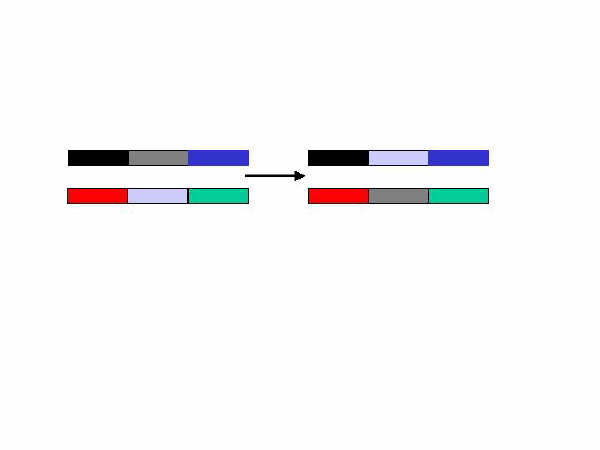
The two bars on the left side represent two chromosomes having three genes each. The genes in the middle cross over during the process of sperm or egg cell formation. The end result is that new linkage relationships exist for the genes on the chromosomes on the right.
Crossover events are actually very common. The rate of crossover events occuring between a gene at locus A and a gene at locus B is proportional to the distance between the two genes on the chromosome (or equivalently, the crossover rate is proportional to the distance between the two loci). A rule-of-thumb for the rate of crossover events in poultry is 1% for every 10 map units in separation between the genes. A map unit is a distance along a chromosome. The actual distance in length units is not really relevant since all chromosome maps are written with distance expressed in map units rather than more familiar units of length.
In the Punnett diagram above describing the gene combinations for two traits, silver and barring, the loci of the genes are linked because they are both on the same chromosome, the Z sex chromosome. This means that the wild-type genes, s+ and b+ genes of the red and non-barred female will be inherited together most of the time. Occasionally a crossover event will occur and the genes will be inherited separately. So, while the Punnett square above gives all the possible combinations of the four genes, it can not be used to determine the percentages that the gene combinations will appear in the progeny that arise from a cross between a male that is a heterozygote for silver and barring and a red, non-barred female.
Since linked genes are inherited together, they can be treated as single entities in the Punnett square. The Punnett diagram below shows the inheritance of silver and barring in the mating of a red, non-barred female and a male that is heterozygous for both barring and silver. This corresponds to the larger Punnett diagram above, but here I consider that fact that the genes are linked and I treat them as a single object:
The results of this Punnett square (the gene combinations inside the square) are what one would get from the mating if no crossover events occurred. The number of times a given gene combination appears inside the Punnett diagram divided by the number of squares in the Punnett diagram is the probability or percent frequency of occurrance of that combination in the progeny. For example, the males are 50% barred and silver and 50% red and non-barred. The females are also 50% barred and silver and 50% red and non-barred. The red, barred male progeny (B b+ s+ s+) that is indicated in the large Punnett diagram above only occurs when a crossover event has taken place, if the parents have the genotype we assumed.
This is an important point, namely that we assumed that the barred, silver male had the B and S genes on the same chromosome. If his genotype had been: Z1 = B s+ and Z2 = b+ S for his two Z chromosomes, the red barred male would have been present in the progeny without requiring a crossover event. The Punnett square for this mating is:
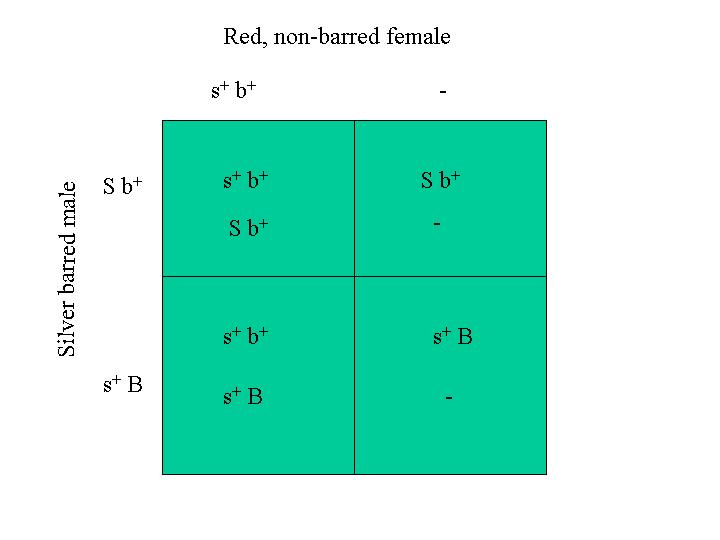
In this mating, half the males are red and barred.
Note from webmaster@Kippenjungle.nl: The genes B and S are more than 50 centiMorgans apart on the Z-chromosome and therefor segregate independantly.
There are varied opinions regarding the issue of inbreeding. One school of thought contends that inbreeding is a negative thing and brings about depression in traits such as fertility, hatchability, rate of lay and others. Another school of thought maintains that the negative aspects of inbreeding can be controlled and even eliminated to a large extent through intelligent selection.
Several studies were conducted in the early part of the twentieth century (for a brief synopsis, see Crawford, Elsevier, 1990, Chapter 39) that showed essentially disasterous results when full sibling fowl were mated for several generations. However, even in the first generation of progeny from full sibling matings in these early studies, traits such as hatchability and rate of lay were seriously depressed. These early studies are largely responsible for many people believing that inbreeding in poultry is universally negative.
Other poultry enthusiasts are aware that inbreeding in plants is a very successful strategy in developing hardy strains with desirable traits. They also recognize that most lines of show-quality poultry are inbred. Research performed in the 1970s and later (see Crawford) on inbreeding in chickens (Leghorns), turkeys, quail, pheasants and partridge fowl showed that desirable traits such as rate of lay, hatchability and fertility can be selected for in inbred lines. These traits can recover from the initial depression due to inbreeding, sometimes even to the same level as the non-inbred lines. A 1988 study by Ameli and co-workers showed that long-term selection against the negative effects of inbreeding can be successful in recovering traits such as high rate of lay and fertility in Leghorn populations.
The depression in traits seen in (random, nonselective) inbreeding, such as fertility, hatchability and rate of lay, is often due to recessive genes. If the depression of these traits were due to dominant genes, the depression would be expressed and observed in non-inbred lines and would not be a phenomenon associated with inbreeding. Epistasis or Epistacy (the interaction of genes at different locations on chromosomes) is sometimes invoked to explain aspects of inbreeding depression.
As of this writing, inbreeding experiments ongoing at the University of Arkansas have associated the greater part of inbreeding depression on hatchability to the male. The evidence for this is the following. Inbred females were mated to a range of different males and the hatchability of their eggs was observed. Inbred males were bred to a range of different females and the hatchability of their eggs were observed. The hatchability of eggs from inbred males was substantially lower than the hatchability of eggs from inbred females, regardless of the cross. So, for example, the hatchability of eggs from a father-daughter cross in which the father is an inbred individual was about the same as the hatchability of eggs from a mating of the same male with non-inbred females. This is strong evidence that the inbreeding depression of hatchability is largely a property of the male birds.
The fact remains that, if the backyard fancier allows inbreeding to take place and does not actively select against the negative effects of inbreeding, the entire population will perform at a lower level with respect to fertility, hatchability, rate of lay and and so on. On the other hand, the objective evidence is convincing that it is possible to develop successful inbred lines of poultry through active selection for desireable traits.
This presentation of genetics tries to limit the use of jargon. However, the interested reader may well want to participate in discussions on the Poultry Genetics discussion board, for example, and will need to know the meanings of some basic terms. Some have already been defined, but others have not.
Cell Differentiation and Reproduction
In the early stages of the development of the embryo, the cells proliferate as they must to grow the early embryo, but they remain essentially identical in that there is no difference among the cells. At a certain point, cells begin to differentiate into specific tissues. Some make heart and circulatory cells, some make kidneys, liver, intestines and so on. What controls cell differentiation is not well understood.
A gamete is the sex cell. In other words it is the sperm of the male or the unfertilized egg (ovum) of the female. In general, the gamete has only half the chromosomes of a mature individual.
Mitosis: There are two types of cell division processes. One process, mitosis, is the division of mature cells in the body cells that have the full compliment of chromosomes (two pairs of chromosomes). The process of mitosis has four identifiable phases:
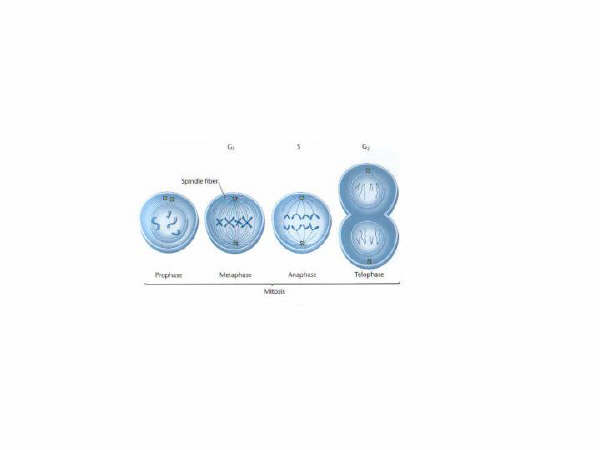
The prophase is an initial organization phase in which the centrioles (small centers from which fibers originate small yellow squares in the figure above) form and become organized. In the metaphase spindle fibers emminate from the centrioles and attach to the chromosomes. The anaphase is characterized by the separation of the chromosomes by the spindle fibres and the centrioles they essentially pull the chromosomes apart. In the telophase the cell wall closes and new cells are evident.
Meiosis: The process of cell division that produces gametes or sex cells (sperm and ovum) . The cells that initiate meiosis contain the full set of chromosomes. However, the process of meiosis yields gamete (sperm and ovum) cells that have half that number of chromosomes. Which chromosomes of the original ones find their way to the gamete cells is essentially a random process. In this process, the chromosomes (of the chromosome pairs of the parents) get mixed or scrambled in a random fashion. This is also the point at which crossing over of genes from one chromosome of a chromosome pair to the other chromosome can occur.